BTC Daily Playbook
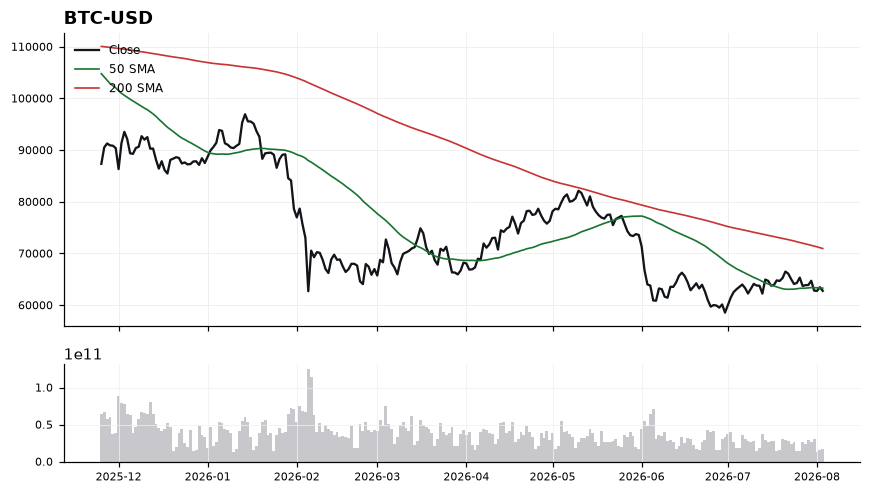
Bitcoin is trading at 63,474.89, essentially pinned to its 50-SMA at 63,351.07 while sitting 10.76% below the 200-SMA at 71,125.14 — a textbook mid-term neutral tape inside a longer-term downtrend, with the 200-day acting as the dominant overhead ceiling. Momentum is mixed but leaning soft: RSI at 47.47 is balanced just under the midline, while MACD at -92.99 has crossed below its signal at 125.68, hinting that short-term trend energy has rolled over even as price holds the 50-day. Immediate support sits at the 50-SMA (63,351); losing that on a closing basis opens air beneath, while resistance stacks toward the 200-SMA zone near 71,125. The setup of interest is a reclaim-and-hold above the 50-SMA with RSI pushing back through 50 and MACD curling toward its signal — that would be the trigger for a mean-reversion attempt toward the 200-day. The thesis weakens on sustained closes back under the 50-SMA with MACD extending its negative spread, and it is outright invalidated if RSI breaks decisively below 40 while price accelerates away from 63,351 to the downside.