BNB Daily Playbook
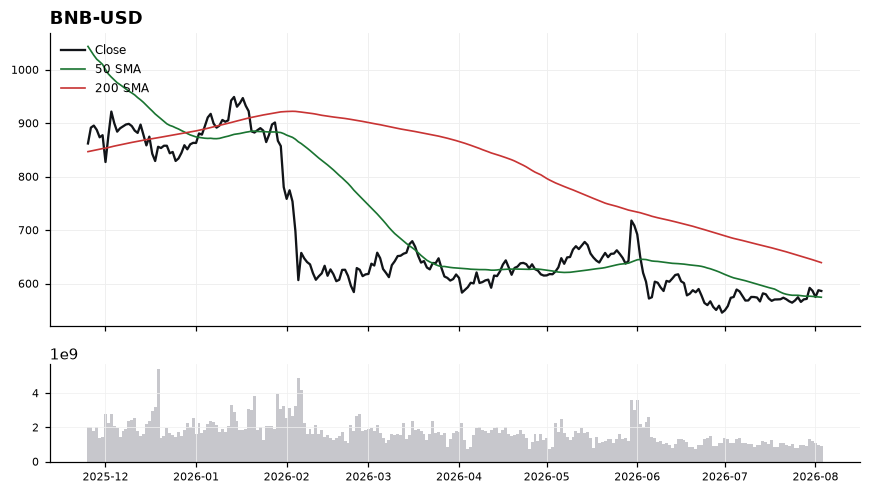
BNB is caught in a mixed regime: price at 587.12 has reclaimed the 50-SMA (575.07) but still trades 8.40% beneath the 200-SMA at 640.98, keeping the broader trend defensive even as short-term momentum improves. RSI at 56.24 sits in constructive-but-not-overbought territory, and the MACD at 1.46 versus its signal at -0.79 confirms a fresh bullish crossover — an early sign that sellers are losing grip. The immediate battleground is the 575 shelf (rising 50-SMA), which needs to hold as support; failure there would reopen the recent range lows and negate the momentum thesis. Overhead, the 640.98 200-SMA is the decisive resistance — a level bulls must overcome to flip the intermediate trend, with the zone between current price and that line acting as the setup's proving ground. The trigger of interest is a sustained daily close back above the 200-SMA on continued MACD expansion; the thesis is wrong on a decisive break and close below 575, which would reassert the downtrend structure implied by the negative distance to the 200-day.