ADA Daily Playbook
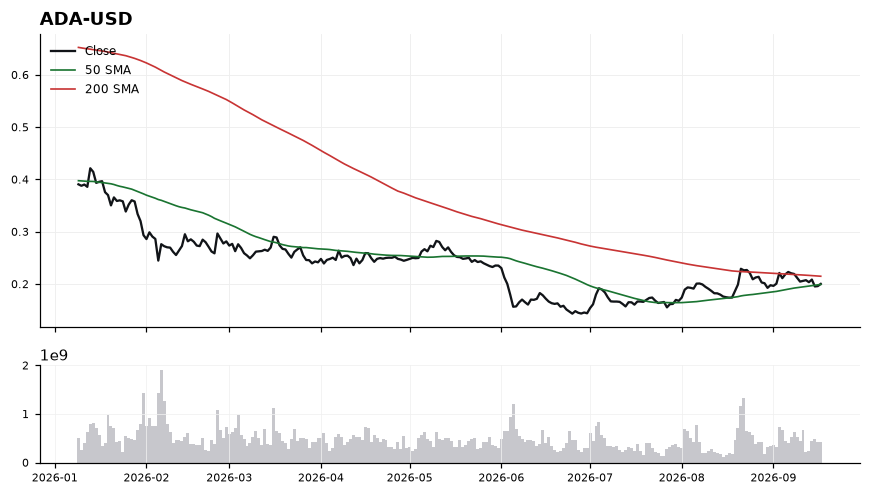
ADA is trading right at its 50-day SMA (0.20) while sitting 8.79% below the 200-day (0.22), which keeps the broader trend tilted lower even as the short-term structure flattens. RSI at 44.43 is mid-range and directionless, and MACD essentially pinned to its signal line confirms the lack of momentum in either direction — this is a coiled tape, not a trending one. Immediate resistance stacks at the 200-SMA near 0.22; reclaiming and holding above that level would be the first technical signal that sellers are losing control, while the 50-SMA at 0.20 is the pivot bulls need to defend to keep any base-building thesis alive. A clean loss of 0.20 with MACD rolling negative and RSI breaking under 40 would shift the setup back to trend-continuation lower and invalidate the neutral read. Conversely, failure to recover 0.22 on any bounce keeps the path of least resistance sideways-to-down beneath a declining longer-term average.