SMCI vs VRT
Side by side
| Metric | $SMCI | $VRT |
|---|---|---|
| Price | 27.78 | 317.58 |
| 50-day SMA | 32.66 | 320.50 |
| 200-day SMA | 35.60 | 222.90 |
| Dist. to 200-day | -22.00% | +42.50% |
| RSI (14) | 38.00 | 51.40 |
| MACD | -0.92 | -5.55 |
Higher distance to the 200-day = stronger long-term trend (highlighted).
$SMCIShort
$VRTLong
The read
$SMCI is showing a clear downtrend (-22.0% vs its 200-day), while $VRT is showing a strong uptrend (+42.5%). On the longer-term trend measure, $VRT has the stronger relative position. The latest Daily Playbook reads $SMCI as Short and $VRT as Long.
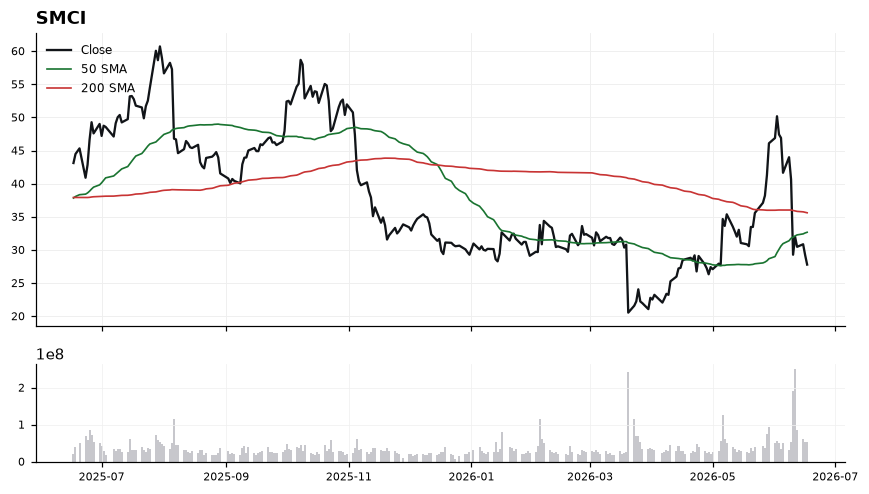
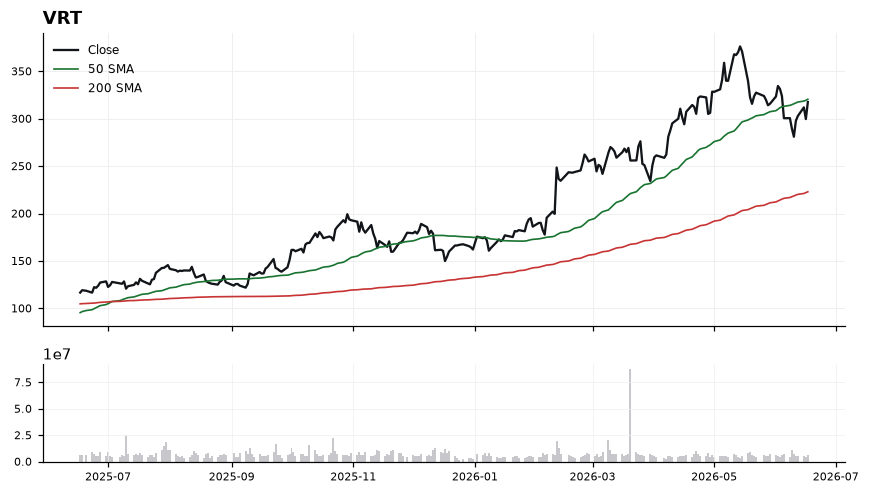
Educational only. Not financial advice. Technicals are end-of-day · as of Jun 17, 2026.