HOOD vs PLTR
Side by side
| Metric | $HOOD | $PLTR |
|---|---|---|
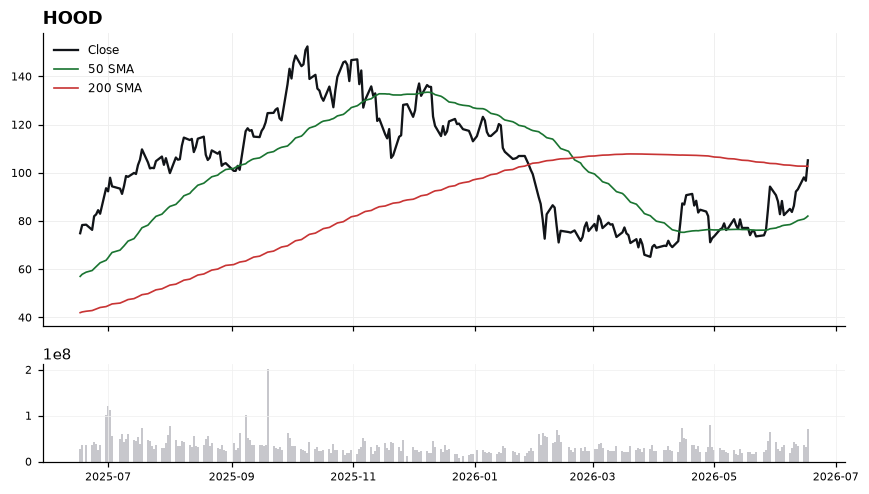
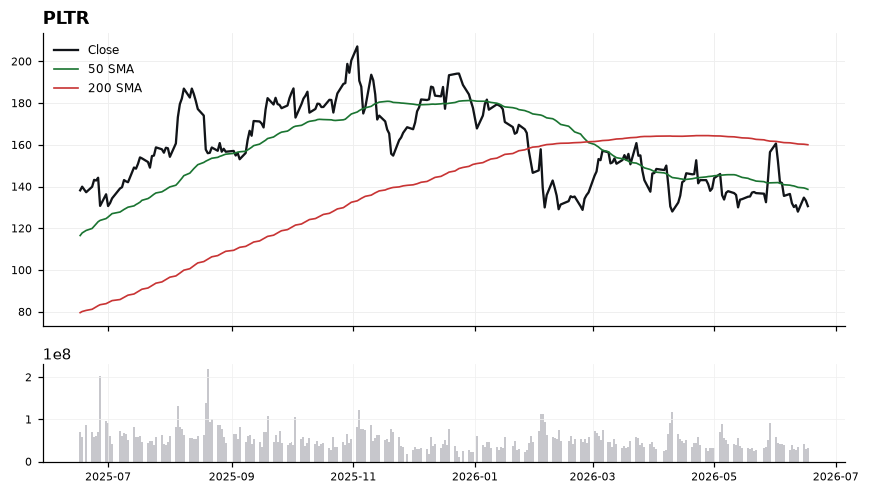
| Price | 105.20 | 130.63 |
| 50-day SMA | 82.08 | 138.68 |
| 200-day SMA | 102.75 | 160.05 |
| Dist. to 200-day | +2.40% | -18.40% |
| RSI (14) | 69.40 | 43.10 |
| MACD | 5.05 | -2.41 |
Higher distance to the 200-day = stronger long-term trend (highlighted).
$HOODLong
$PLTRShort
The read
$HOOD is showing a mild uptrend (+2.4% vs its 200-day), while $PLTR is showing a clear downtrend (-18.4%). On the longer-term trend measure, $HOOD has the stronger relative position. The latest Daily Playbook reads $HOOD as Long and $PLTR as Short.
Educational only. Not financial advice. Technicals are end-of-day · as of Jun 17, 2026.