BITX vs ETHU
Side by side
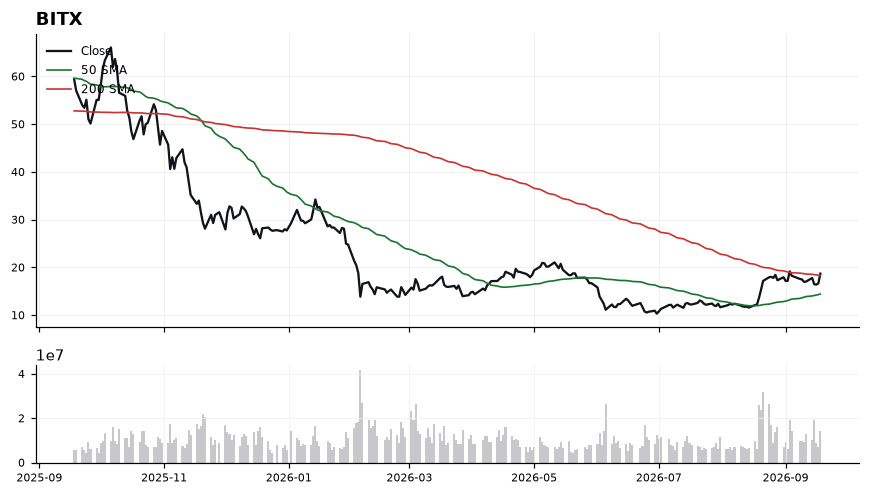
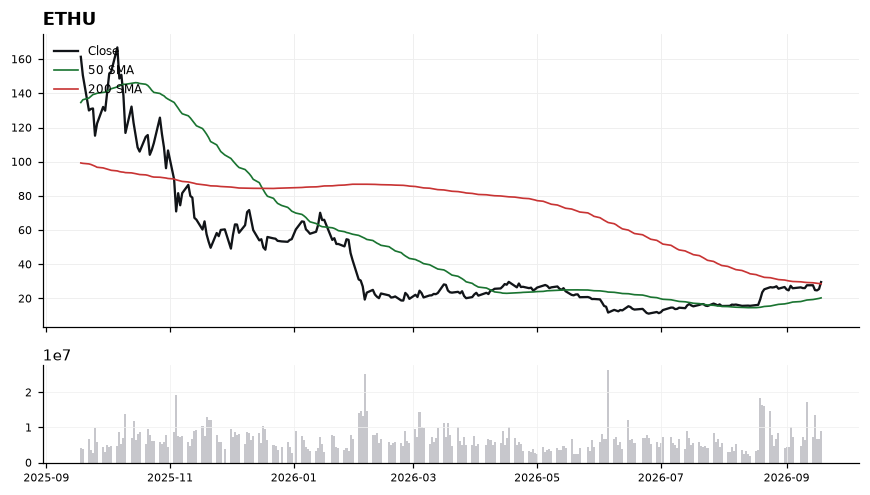
| Metric | $BITX | $ETHU |
|---|---|---|
| Price | 18.70 | 29.59 |
| 50-day SMA | 14.44 | 20.34 |
| 200-day SMA | 18.30 | 28.57 |
| Dist. to 200-day | +2.20% | +3.60% |
| RSI (14) | 63.20 | 67.70 |
| MACD | 0.83 | 1.92 |
Higher distance to the 200-day = stronger long-term trend (highlighted).
$BITXLong
$ETHULong
The read
$BITX is showing a mild uptrend (+2.2% vs its 200-day), while $ETHU is showing a mild uptrend (+3.6%). On the longer-term trend measure, $ETHU has the stronger relative position. The latest Daily Playbook reads $BITX as Long and $ETHU as Long.
Educational only. Not financial advice. Technicals are end-of-day · as of Sep 18, 2026.