ANET vs DELL
Side by side
| Metric | $ANET | $DELL |
|---|---|---|
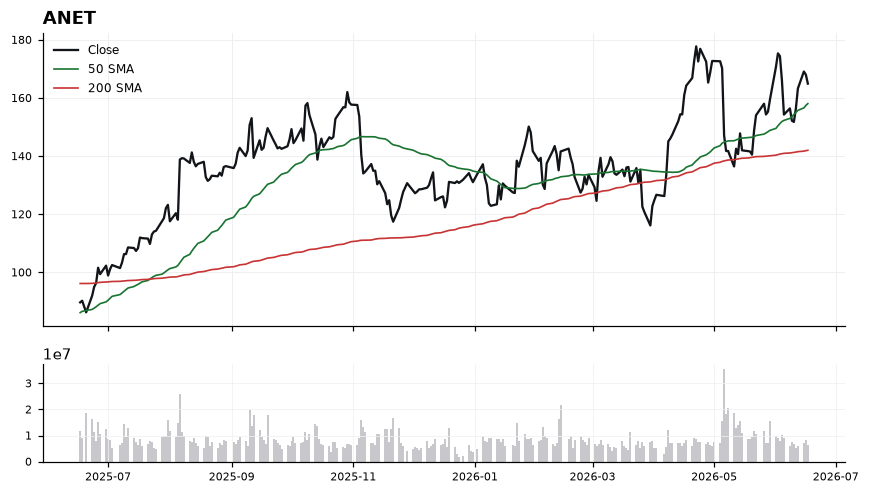
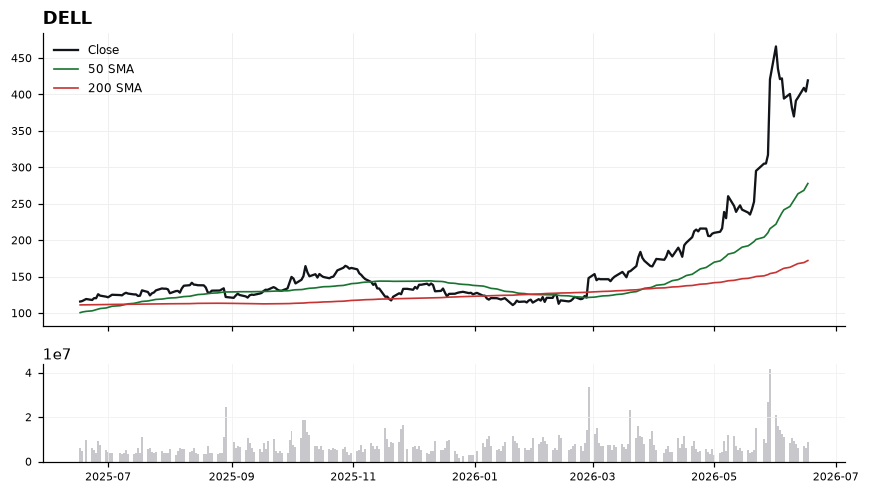
| Price | 164.93 | 419.32 |
| 50-day SMA | 158.04 | 277.85 |
| 200-day SMA | 142.00 | 172.17 |
| Dist. to 200-day | +16.10% | +143.60% |
| RSI (14) | 55.50 | 67.60 |
| MACD | 2.97 | 40.03 |
Higher distance to the 200-day = stronger long-term trend (highlighted).
$ANETLong
$DELLLong
The read
$ANET is showing a strong uptrend (+16.1% vs its 200-day), while $DELL is showing a strong uptrend (+143.6%). On the longer-term trend measure, $DELL has the stronger relative position. The latest Daily Playbook reads $ANET as Long and $DELL as Long.
Educational only. Not financial advice. Technicals are end-of-day · as of Jun 17, 2026.