AMZN vs TSLA
Amazon.com, Inc. (AMZN) compared with Tesla, Inc. (TSLA).
Side by side
| Metric | $AMZN | $TSLA |
|---|---|---|
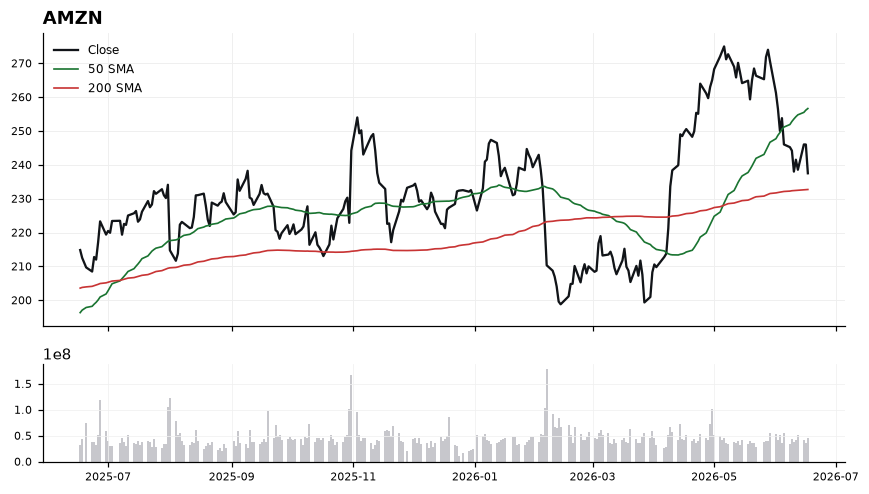
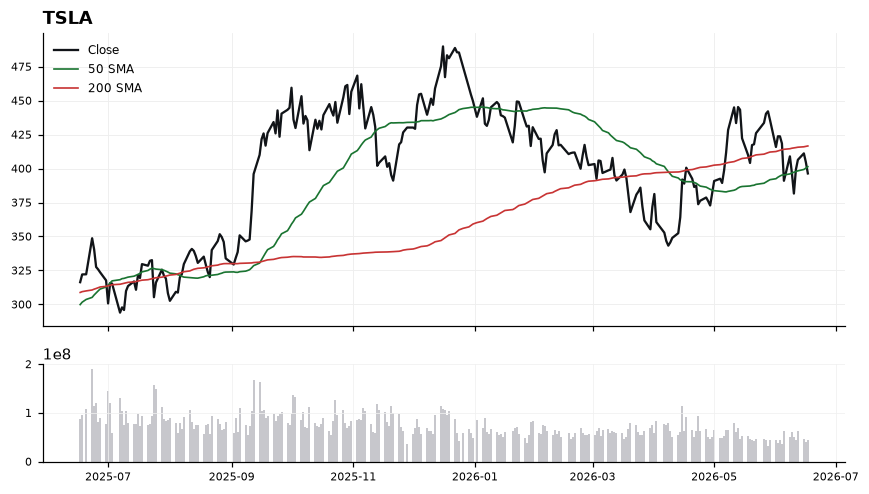
| Price | 237.50 | 396.38 |
| 50-day SMA | 256.64 | 401.34 |
| 200-day SMA | 232.71 | 416.61 |
| Dist. to 200-day | +2.10% | -4.90% |
| RSI (14) | 36.90 | 45.30 |
| MACD | -5.11 | -2.62 |
Higher distance to the 200-day = stronger long-term trend (highlighted).
$AMZNLong
$TSLAWatch
The read
Amazon.com, Inc. ($AMZN) is showing a mild uptrend (+2.1% vs its 200-day), while Tesla, Inc. ($TSLA) is showing a mild downtrend (-4.9%). On the longer-term trend measure, Amazon.com, Inc. has the stronger relative position. The latest Daily Playbook reads $AMZN as Long and $TSLA as Watch.
Educational only. Not financial advice. Technicals are end-of-day · as of Jun 17, 2026.