AAPL vs GOOGL
Apple Inc. (AAPL) compared with Alphabet Inc. (GOOGL).
Side by side
| Metric | $AAPL | $GOOGL |
|---|---|---|
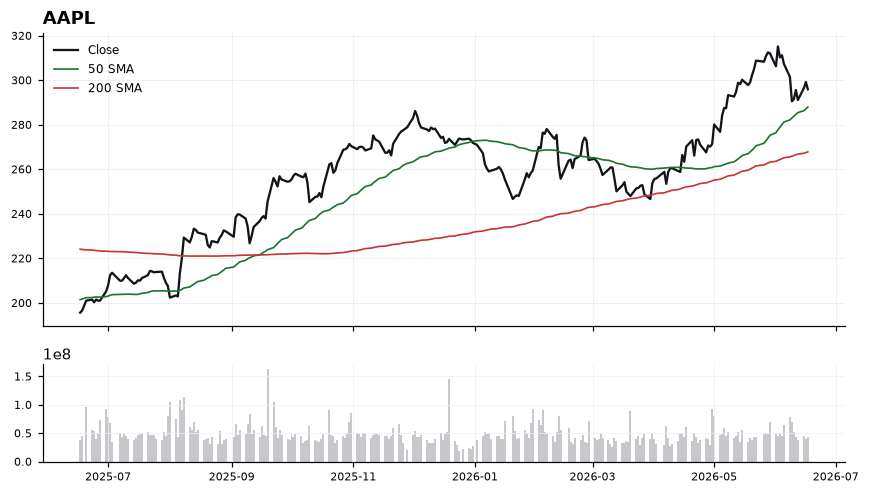
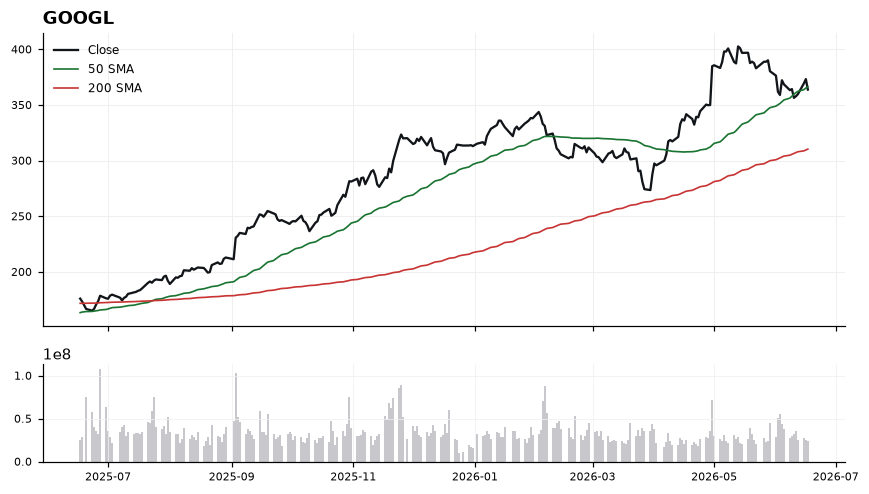
| Price | 295.95 | 363.79 |
| 50-day SMA | 287.96 | 366.36 |
| 200-day SMA | 267.85 | 310.32 |
| Dist. to 200-day | +10.50% | +17.20% |
| RSI (14) | 48.90 | 46.10 |
| MACD | 1.33 | -2.04 |
Higher distance to the 200-day = stronger long-term trend (highlighted).
$AAPLLong
$GOOGLLong
The read
Apple Inc. ($AAPL) is showing a strong uptrend (+10.5% vs its 200-day), while Alphabet Inc. ($GOOGL) is showing a strong uptrend (+17.2%). On the longer-term trend measure, Alphabet Inc. has the stronger relative position. The latest Daily Playbook reads $AAPL as Long and $GOOGL as Long.
Educational only. Not financial advice. Technicals are end-of-day · as of Jun 17, 2026.